Getting a quick overview of the status of a project
Note
This user guide presents how a quick assessment can be done of the fuzzing status of a given project. The idea behind this type of assessment is to answer the questions:
What’s the high-level status of fuzzing the project?
Is there room for improving the fuzzing set up?
If there is room for improvements, what are the areas that seem most intuitive to improve?
The goal is to come up with answers to the above in 5-10 minutes time, which assumes one is comfortable with Fuzz Introspector. Likely, the first couple of times you use Fuzz Introspector it will take much more time.
This user guide will use the htslib project for a demonstration purposes, and will do our analysis by way of OSS-Fuzz.
First, we will clone OSS-Fuzz and generate a Fuzz Introspector report. For the Fuzz Introspector we will generate the runtime coverage using the public corpus available from OSS-Fuzz. This is achieved with the following steps:
# Clone OSS-Fuzz
git clone https://github.com/google/oss-fuzz
cd oss-fuzz

# Generate introspector report.
# Run each fuzzer for htslib for 300 seconds to collect code coverage.
python3 ./infra/helper.py introspector htslib --public-corpora

# Start webserver
python3 -m http.server 8008 \
  --directory ./build/out/htslib/introspector-report/inspector/
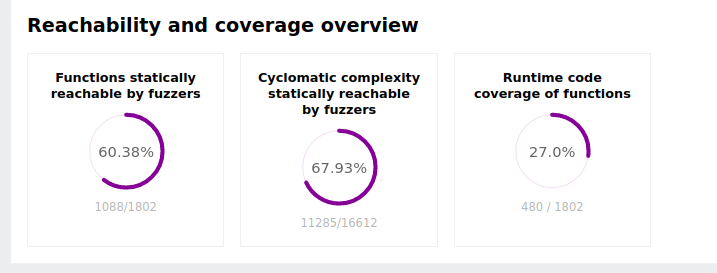
The first step is to assess the static reachability of the code as well as the runtime code coverage. This is given by the diagrams at the top section of the report:
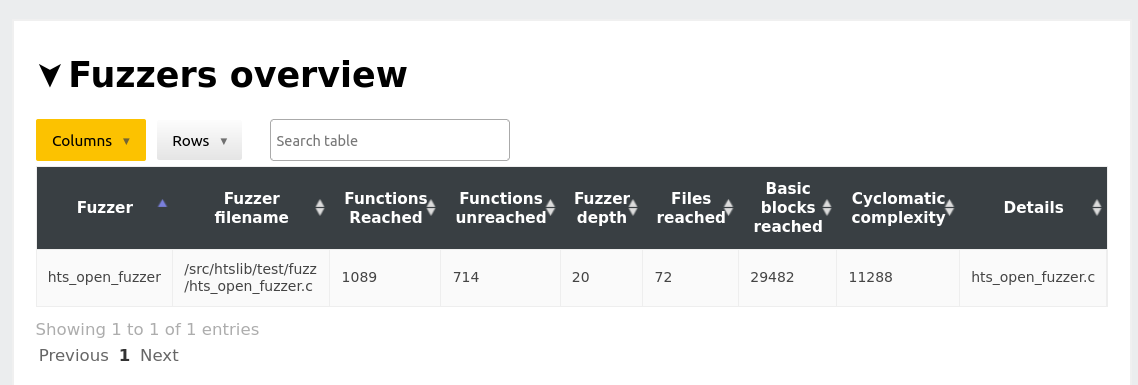
Next, we skim over the fuzzer overview table. In the case of htslib we see there is a single fuzzer, so all reachability and code coverge reported in this report is given by this fuzzer.
At this point we can draw light conclusions about the first two questions from our stating point:
What is the high-level status of fuzzing the project? There is a single fuzzer for the project as a whole. The fuzzer has high reachability (60%) of all functions and even higher reachability of cyclomatic complexity (67%). In this sense, the fuzzer targets the majority of the code. However, the project has significantly lower runtime code coverage than it has static reachability. This is an indication there may be something at runtime that stops the fuzzer from exploring significant parts of the code.
Is there room for improving the fuzzing set up? Yes, and likely the improvement needed is increased code coverage as the fuzzer will have a lot of the logic for reaching most of the code.
At this point we move on to try and find an answer to the third question: If there is room for improvements, what are the areas that seem most intuitive to improve? Since at this point we know there is room for improvement, our goal is to identify where we can do these improvements.
From our work so far, one of the observations we have is that runtime code coverage is significantly lower then statically reachable code. This means that some of the code that the fuzzer should be able to execute is actually not being executed: there will be code coverage gaps in the statically extracted callgraph of the fuzzer. To explore this idea further, we navigate to the section Fuzzer details -> Fuzzer: hts_open_fuzzer -> Call graph. This section has a shortcut in the table of contents on the left-hand side. Here, we see the following overview of the callgraph overlaid with code coverage:
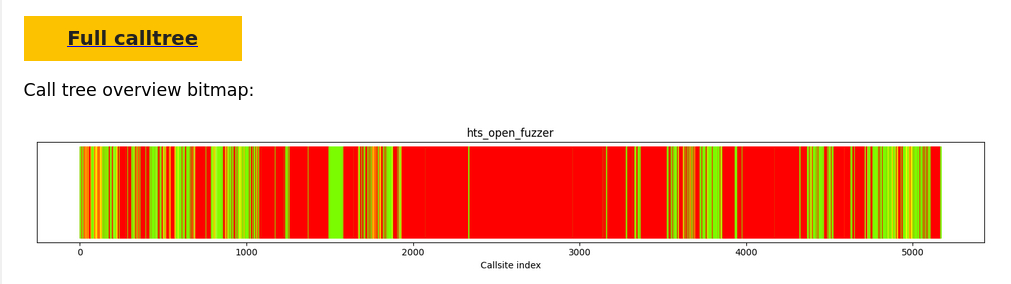
This figure shows the function-level call-graph of the fuzzer, where the x-axis holds the nodes of the callgraph. The entrypoint of the fuzzer is the leftmost element on the x-axis and the last node in the callgraph is the right-most element. The coloring indicates whether a given node was covered at runtime.
The figure shows us there are in particular three sections of the callgraph that are uncovered at runtime. These are the rough x-axis intervals [1050 : 1800], [1950 : 3600] and [3800 : 4300], where the largest interval of red nodes is beginning around 1950.
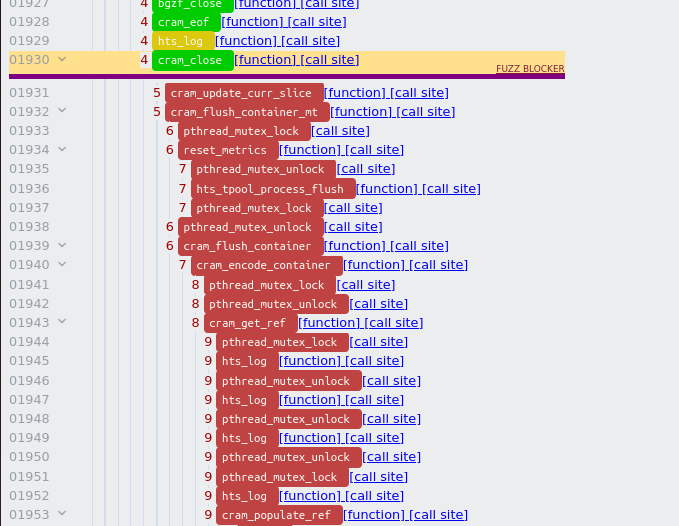
The next step is to understand why these uncovered intervals are not being coverage. The fuzz blocker table below the call graph overview can assist here, where the two top rows are as follows:
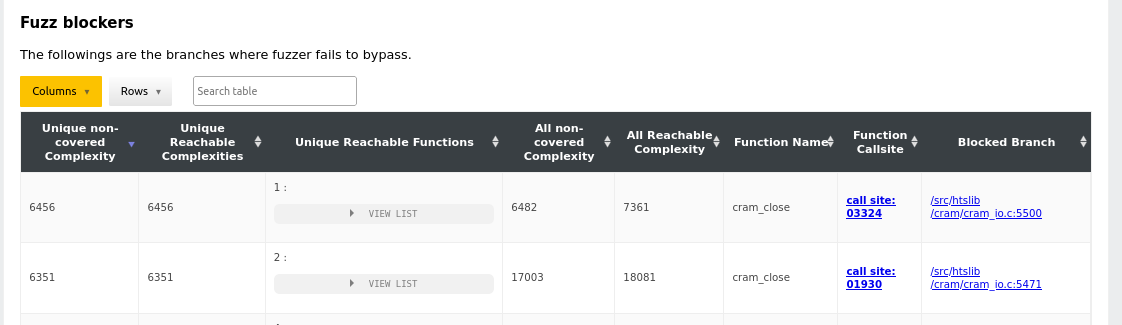
The Function Callsite column presents us with a link as well as call site number (corresponds to the number on the x-axis). The second row of the table lists a fuzz blocker at position 1930, which correlates well with the data we extracted above and in particular the blocked interval estimated at [1950 : 3600]. At this point, we follow the link in a new tab which takes us to the location:
We can collapse a node in the calltree by using the arrows on the left side, and doing that on the nodes just below the fuzz blocker gives:
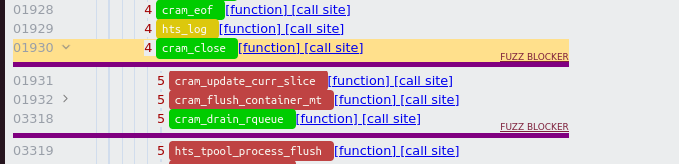
After collapsing the element we can observe the uncovered node has a large subtree in the callgraph, namely it contains the nodes [1932 : 3317].
At this stage we have a good understanding of where inefficiency exists. The next step is to map this understanding onto the actual code of htslib, such that we can look at the code in order to understand how to overcome this inefficiency. To do this, we go back to the Fuzz Blocker table and observe the rightmost column of the table. This column, Blocked branch gives us the conditional branch that Fuzz Introspector determines is responsible for the inefficiency. Each row in this column has the precise source code in the code coverage report, and a link is provided to it. Navigating to the destination of the link gives us:
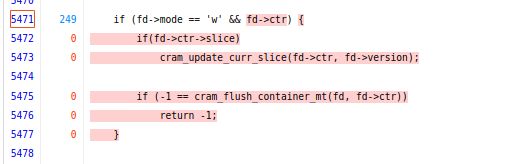
Looking at the code, without much knowledge about htslib itself, we can see
the if (fd->mode == 'w' fails in each fuzz run and this causes the fuzzer
not to explore the underlying code. We can also observe the
cram_flush_container_mt function call from inside the conditional statement
corresponds to the node in the callgraph that we collapsed, meaning that this
is the exact function call we want to trigger in order to increase the code
coverage of our fuzzer. It is fair to assume that the fd->mode corresponds
to some mode that a given file description is opened with. Based on the report,
we can conclude that this is likely always != 'w' for each fuzz run, and this
is what we have to overcome.
Looking at the source code of the fuzzer, which we can do by way of the code coverage report (accessible in the upper-left corner of Fuzz Introspector), we can see the following lines of code:
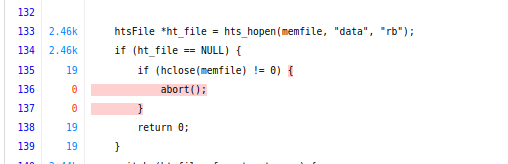
The code opens a file using the mode rb. A reasonable assumption at this point
is this may be related to check == w failing.
At this point, we will stop our initial study as we have enough analysis for
coming up with an answer to the original question what are the areas that seem most intuitive to improve?:
The most intuitive approach at this point is to try and modify the fuzzer such
that it opens files in w mode, as it seems like the current state is limited
to rb, and the effect of this is that a large part of the control-flow graph
is uncovered.