Identify and analyse fuzz blocker
Fuzz Introspector provides certain features aimed at identifying any blockers that fuzzers may run into. In general terms, a fuzz blocker is something that stops a fuzzer from exploring a certain part of the code. These blockers can cause fuzzers to achieve sub-optimal code exploration and should be resolved if possible. In this section we will discuss fuzz blockers and how Fuzz Introspector can help find these blockers.
Identify blockers visually
In order to capture fuzz blockers Fuzz Introspector fundamentally combines the code coverage of a fuzzer at runtime with an approximation of the code that a fuzzer should optimally explore. Identifying what a fuzzer should optimally explore is a difficult task, and the goal of Fuzz Introspector is not to get a perfect answer to this, but rather to provide something useful and pragmatic for the fuzzer developer. Fuzz Introspector uses the control-flow graph of a fuzzer as the definition of what it should optimally achieve.
The simplest way Fuzz Introspector helps find fuzz blockers is by visualising the calltree of a fuzzer, with colouring on each node the calltree indicating if the node was hit at runtime or not.
For an example, consider the following calltree (taken from this report):
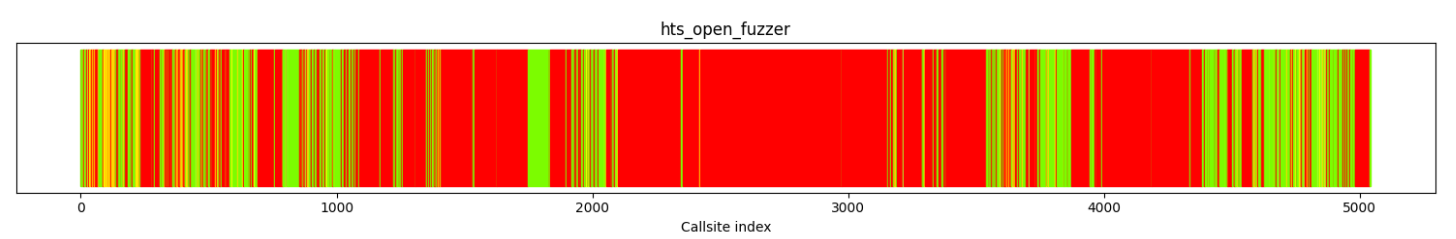
The calltree is arranged such that the X-axis shows the callgraph of the fuzzer, with the leftmost value being the entrypoint of the fuzzer and the rightmost being the ending of the fuzzer. The nodes are created in a depth-first search manner.
The colouring of the nodes have the following meaning: - Red: the node was not covered at run time - Yellow: the node was covered a few times at run time - Green: the node was covered many times at run time
From the figure we extract the following conclusions: - There is a large part of the fuzzer the fuzzer’s calltree that has not been covered - The nodes in the calltree at around 1100, 2100 and 4000 are the beginnings of large gaps
As such, the figure itself gives us a good quick understanding of the context. The next steps are to understand the blockers further.
Inspect blockers at the calltree page
Fuzz Introspector can tell us more about the blockers. One way of doing this is inspecting the dedicated calltree page. There is a dedicated calltree page per fuzzer and is accessible by the yellow button Full calltree:
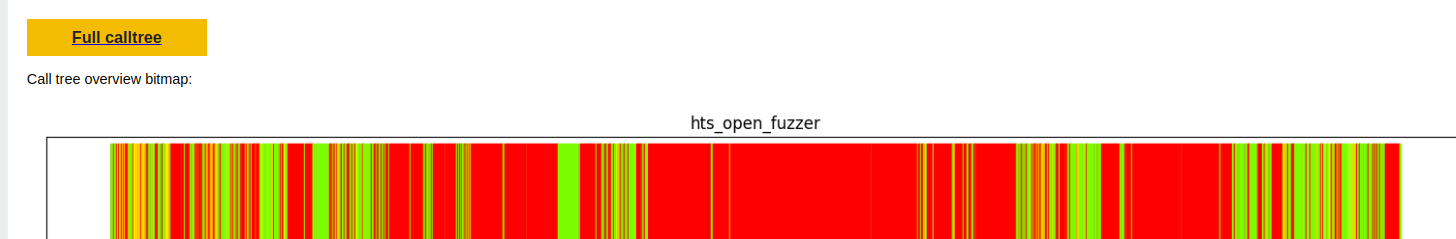
The page this takes us to in the above example is here Following this button we get to the dedicated calltree page. At the top of this page there is a table with blockers. We will ignore this for now, and get to it in the section. Below the fuzz blocker table, there is a section which holds the calltree in a vertical manner with colouring corresponding to the runtime code coverage:
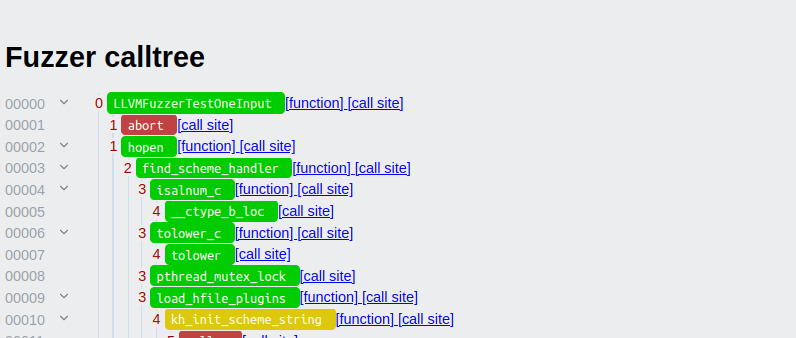
The values on the left-hand side correspond to the values on the X-axis in the bitmap overview above. As such, we can scroll to around node 1100 where we estimated that a blocker exists:
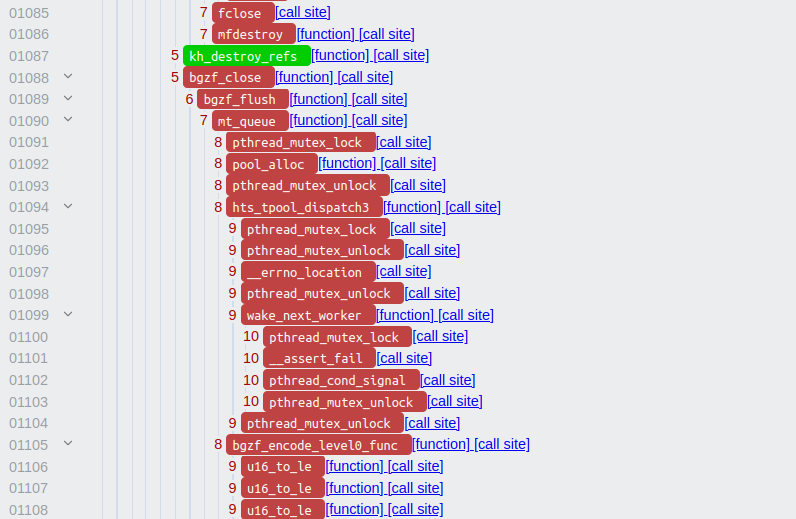
The calltree shows us that node 1088 is the beginning of a long sequence of
red nodes. We can follow the link in the call tree link, which gives
us the exact location where the callsite to bgzf_close is:

At this point, we have the exact location in the source code that blocks a significant piece of code to not be executed by the fuzzer. At this stage, we can proceed with studying the reason why this condition is not being triggered.
A natural next step is to inspect the other places where we identified potential blockers visually. For each of those places we can follow a similar pattern to identify the exact locations in code where code coverage changes from green to red.
Inspect branch-level fuzz blockers
In addition to the above techniques for identifying fuzz blockers, Fuzz Introspector also provides more detailed analysis on which exact code branches are causing the blocking. These are called branch blockers.
The table at the top of the dedicated calltree page lists the branch blockers identified by Fuzz Introspector:
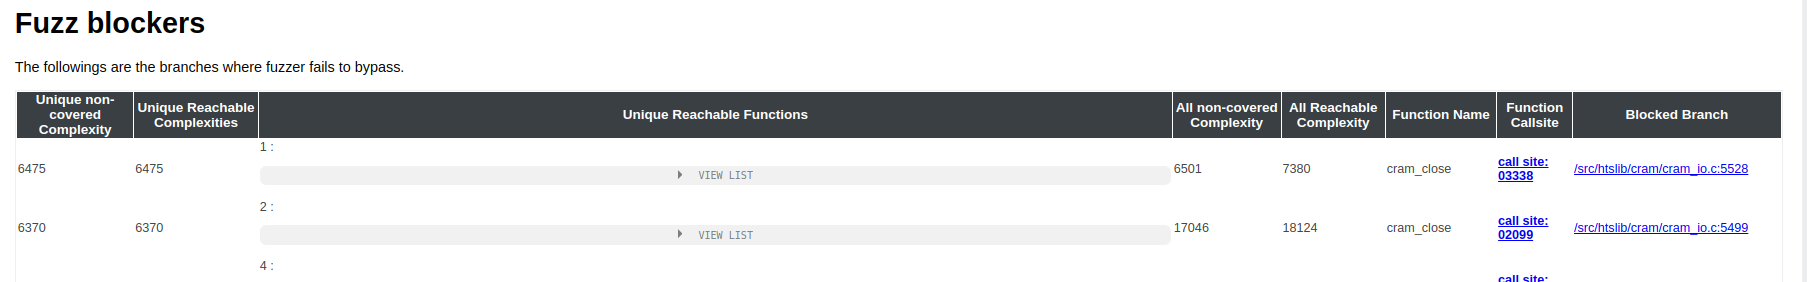
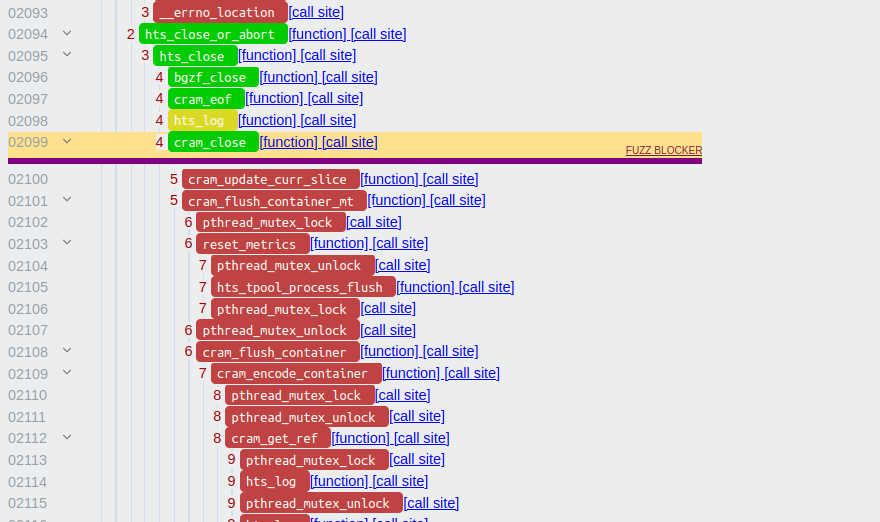
The blockers are ranked based on how much code they are blocking, which is identified based on the code complexity they block. The two rightmost columns give us further information about the location of these blockers. First, the callsite column gives us the exact location in the calltree. However, the calltree is composed of callsites, i.e. the nodes in the calltree are callsites, and the branch blockers refer to conditional statements in the code. As such, a branch blocker exists in-between two nodes in the calltree. For example, the second ranked branch blocker exists between 2099 and 2100 (clicking the link takes you to the location in the calltree):
Finally, the rightmost column in the blocker table gives the exact code location in the source code where the blocker exists. Clicking the link there will take us to the branch as it is in the code coverage reports, and in the event of the second ranked branch blocker in the above example we get:
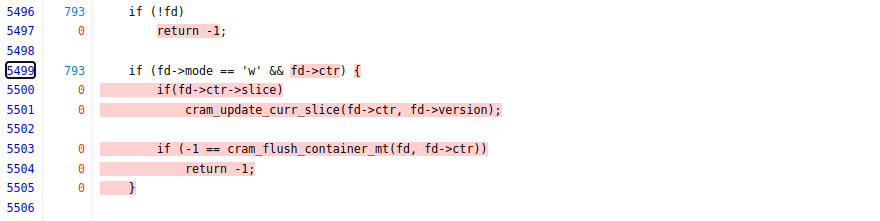
In this case, we can see that fd->mode == 'w' blocks the fuzzer from entering
the condition which unlocks a lot of code coverage. In this case, this is indeed
because the fuzzer performs some file operations, however, the fuzzer itself
always opens the file in read-only (fd->mode is set to r).