Identify how well a specific function is fuzzed
Note
Why is it relevant to identify function-specific info?
The assumption when looking for function-specific information is that you have particular interest in a given function. The reasons you could have this is e.g. the function has particular criticality with respect to the threat model of the code, the code of the function is particularly volatile and changes often so it’s important to ensure fuzzing continues to analyse all corners of the function, or something third.
The target project we want to analyse is libdwarf and the target
function we want to study is _dwarf_debuglink_finder_internal.
In this example we will use an existing OSS-Fuzz report available for us to study rather than building it ourselves. We’ll use the following publicly available libdwarf OSS-Fuzz report
We will use the table available in the project functions overview section.
This table gives us information about each function in the project and also provides a relevant link to the code coverage report if available. We use the search functionality of the table to find our code, which gives us:
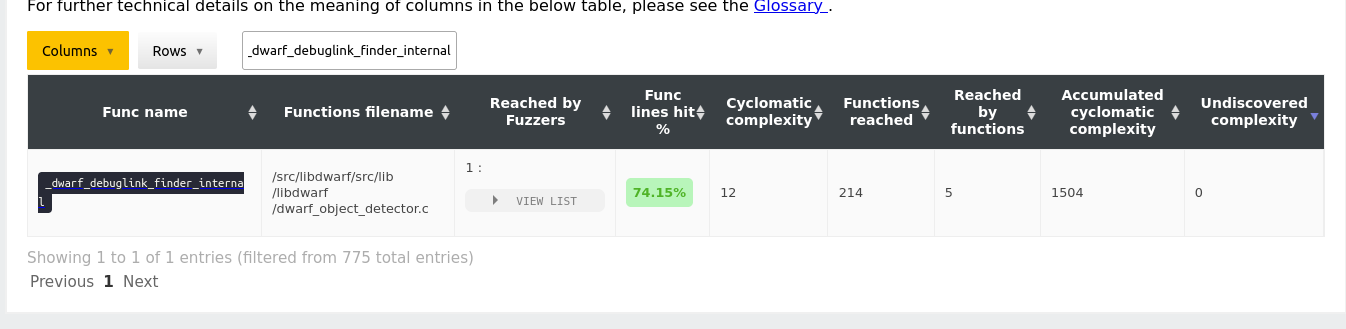
The
Reached by Fuzzerstells us the number of fuzzers that statically reach this code. In this case, if we unfold the list of the column we see the fuzzer that reaches this code isfuzz_init_path.The
Func lines hittells how many percentage of the source code lines of the function is coverage at runtime, by way of code coverage collection. This means it represents the real execution of the code as achieved by the corpus of the existing fuzzing set up. In this case, we can see that74.15%of the code is covered.
The rest of the columns are important too, however, they do not reveal much
to us with respect to how well the function is fuzzed. Rather they tell us
parts about the function e.g. is it a complex function and how much code it
reaches, so we will not go in-depth with these columns at this moment. Instead
we conclude that a larger fraction of the function is fuzzed
(74.15%) and it is being analysed by a single fuzzer.
The next step is to assess what code of the function is being fuzzed. To assess this we use the URL provided by the name of the function to get direct access to the code coverage report affiliated with this Fuzz Introspector report. So, we click the URL of the function name in the table, which takes us to the following URL.
Looking at the code we see the following lines are uncovered:
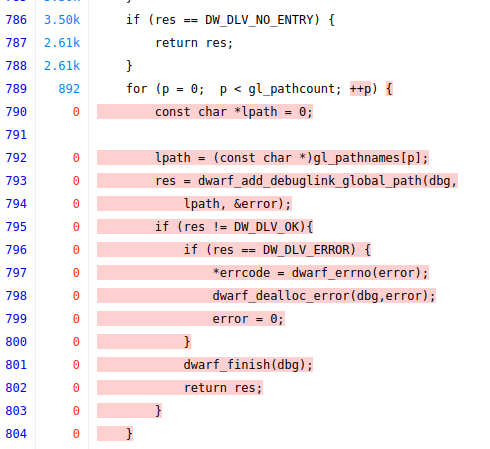
and
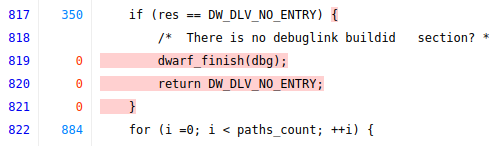
and
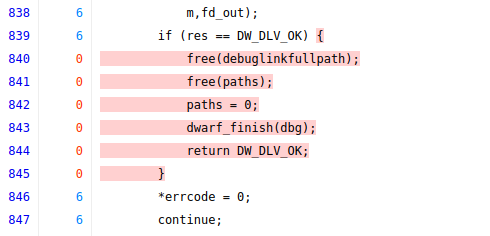
We can now conclude that the code is well-fuzzed in general as the coverage is high. We can extend the fuzzing by having more than one fuzzer target the code, for new fuzzers a good idea is to try and trigger the function in a different way than the existing fuzzer with the goal of analysing the uncovered code.